This Formal Verification issue is free for everyone. If you don’t want to miss out on the latest research on digital assets and decentralised networks then hit that subscribe button today.
Crypto Capital Assets
This research is an extension on Lucas Campbell's Bankless article, ‘How to value crypto capital assets’. In the article, Lucas analyses a collection of money protocols that each have an earnings mechanism. By studying these earnings, it is often argued that one could apply a P/E Ratio to value these assets in a very similar way to traditional finance modelling. By doing so, assets can be compared to one another on a valuation basis at a given point in time.
However, this doesn’t consider the dimension of time or the continuous evolution of decentralised networks. In other words, what is the relationship between a cryptoasset’s price relative to its earnings over time for a particular network? Networks frequently undergo radical changes which can transform their token economic model completely (e.g. 0x V3, Kyber’s Katalyst) which may fundamentally alter the relationship between the two variables.
For the below analysis, we will focus on networks that have a publicly tradable token and with a respective fee mechanism (note - Augur has been removed due to being in a protracted V2 transitionary period). At the end we will discuss why new P/E frameworks are needed for this new technological paradigm.
As a refresher, here is a quick rundown of earning mechanism for each respective token in the analysis:
MakerDAO - Interest paid by debtors in the system is burned increasing MKR holders’ proportional ownership of the total network value.
Kyber - Percentage of fees is burned increasing KNC holders’ proportional ownership of the total network value.
0x - Fees collected by market makers are distributed out directly to MMs and ZRX stakers.
Bancor - Percentage of trading fees is distributed out to liquidity providers on the network.
Aave - A percentage of interest accrued is burned increasing LEND holders’ proportional ownership of the total network value.
Synthetix - SNX stakers that mint synthetics are distributed trading fees.
Comparing Crypto Capital Assets
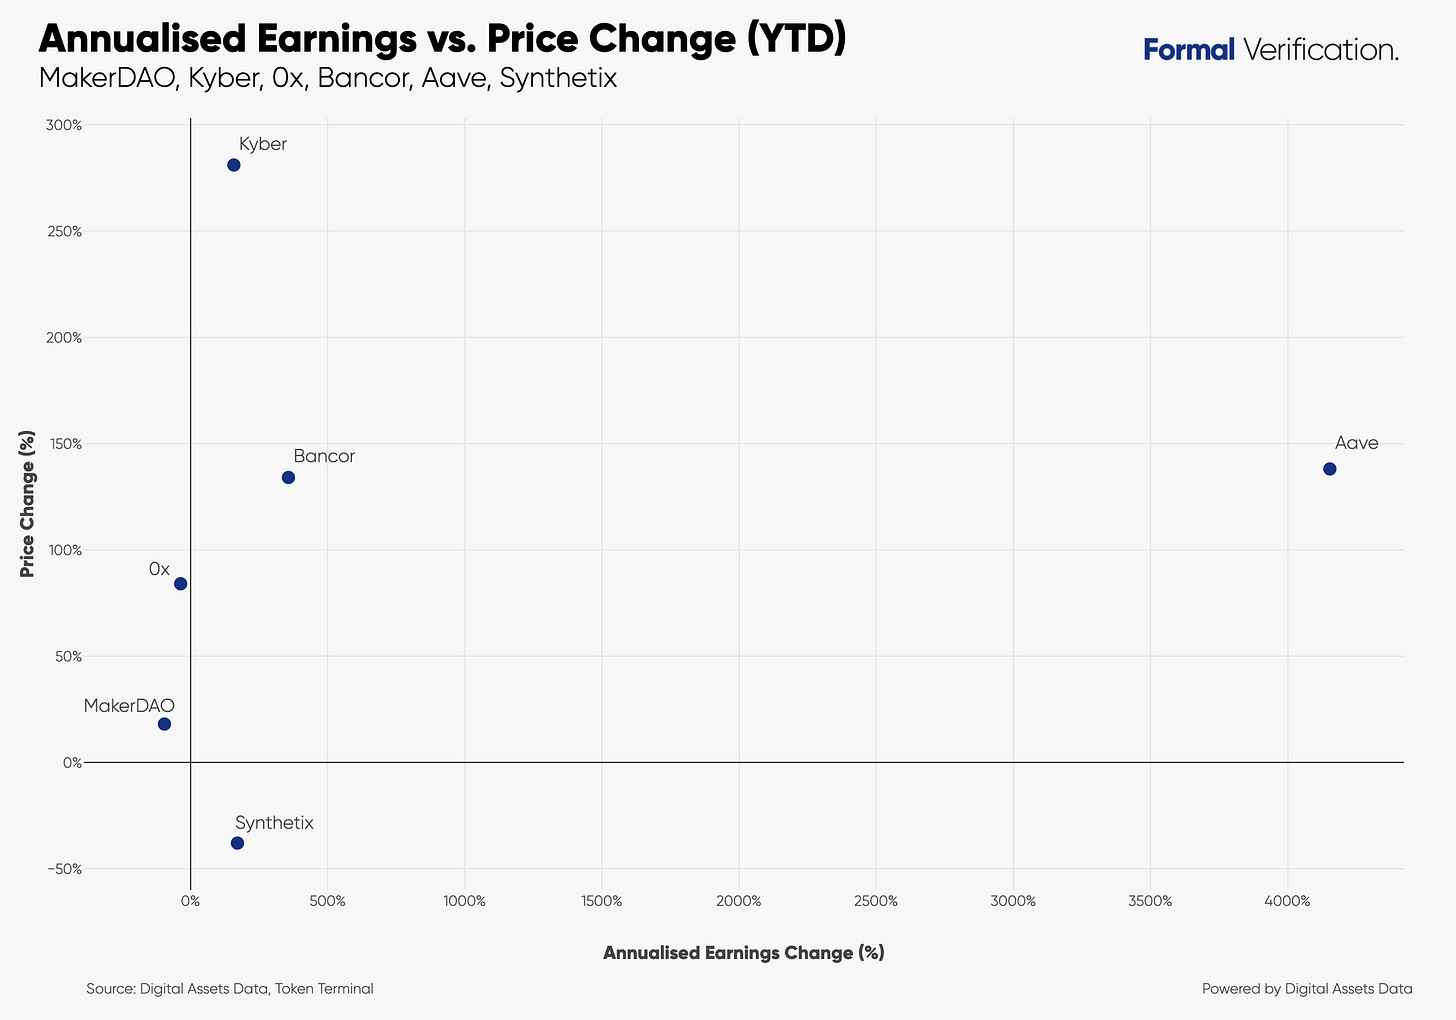
To start understanding the relationship between annualised earnings and the underlying network token performance over 2020, we could perform a single snapshot correlation analysis similar to the Bankless article. While we clearly cannot infer causation, we can see that at the end of May, the increase in annualised earnings for Kyber, Aave, and Bancor has corresponded with positive token performance. Based on these single data point analysis, Aave has the lowest P/Es by far (4100% increase in annualised earnings with only a 138% increase in price).

Of course, the above only provides a snapshot of the relationship on a given day leaving the possibility that some (or all) of these might be mere outliers. Just like volatility in the market, earnings for DeFi protocols can vary to a great degree. For example, since the start of the year, there is a tremendous amount of variation in a protocol’s projected earnings. We therefore need to factor in this variation along with variation in token prices during this period to better understand the dynamic relationship between these two variables for a given protocol over a period of time. We can also provide context to explain possible changes in their relationship in a given period of time.

Protocol Earnings vs Price Correlations (YTD)
Kyber
Kyber’s liquidity protocol has grown significantly over the last year with trading volume consistently reaching over $2m on a daily basis. This increase in volume has translated to an average annualised earnings of $2.1m in May from $1.4m in January. This increase in annualised earnings has been weakly positively correlated with KNC price performance (note - coefficient of determination is very low). Arguably one of the reasons for this weak correlation for the period is down to growing speculation around Kyber’s upcoming Katalyst upgrade recently - In the last few weeks, KNC price continues to rise relative to the start of the year at a greater rate while annualised earnings stays between 100-250%.

This upgrade is important to note as the protocol will change from being a pure burn model to a hybrid (burn and direct fees) where parameters will be governed by KNC stakers in the KyberDAO. Crucially, the DAO members will decide how much or little they wish to reward liquidity reserves and KNC stakers.
SNX
As seen above, Synthetix dominated the annualised earnings market share during January and early February. However, since front-running was cracked down on the network, annualised earnings have reduced dramatically since and price has correspondingly fallen. What is important to note is that despite initial spikes earnings, SNX did not show a positive trend in performance. Let’s get some context.

SNX quickly moved into overbought territory towards the end of 2019 as more users were incentived to capitalise on high staking issuance at the time. The non-organic annualised earnings growth mean that front-runners were highly profitable. Given Synthetix’s network design, this profitability was at the expense of other SNX stakers - all SNX holders collectively own the total network debt (zero-sum game). Confused SNX stakers were faced with closing down their debt positions or buying even more SNX off the market to avoid liquidation. They key thing here is that increased earnings may not necessarily translate to an increase in price change. We need to understand how the network is designed and what the current state the network is in.
0x
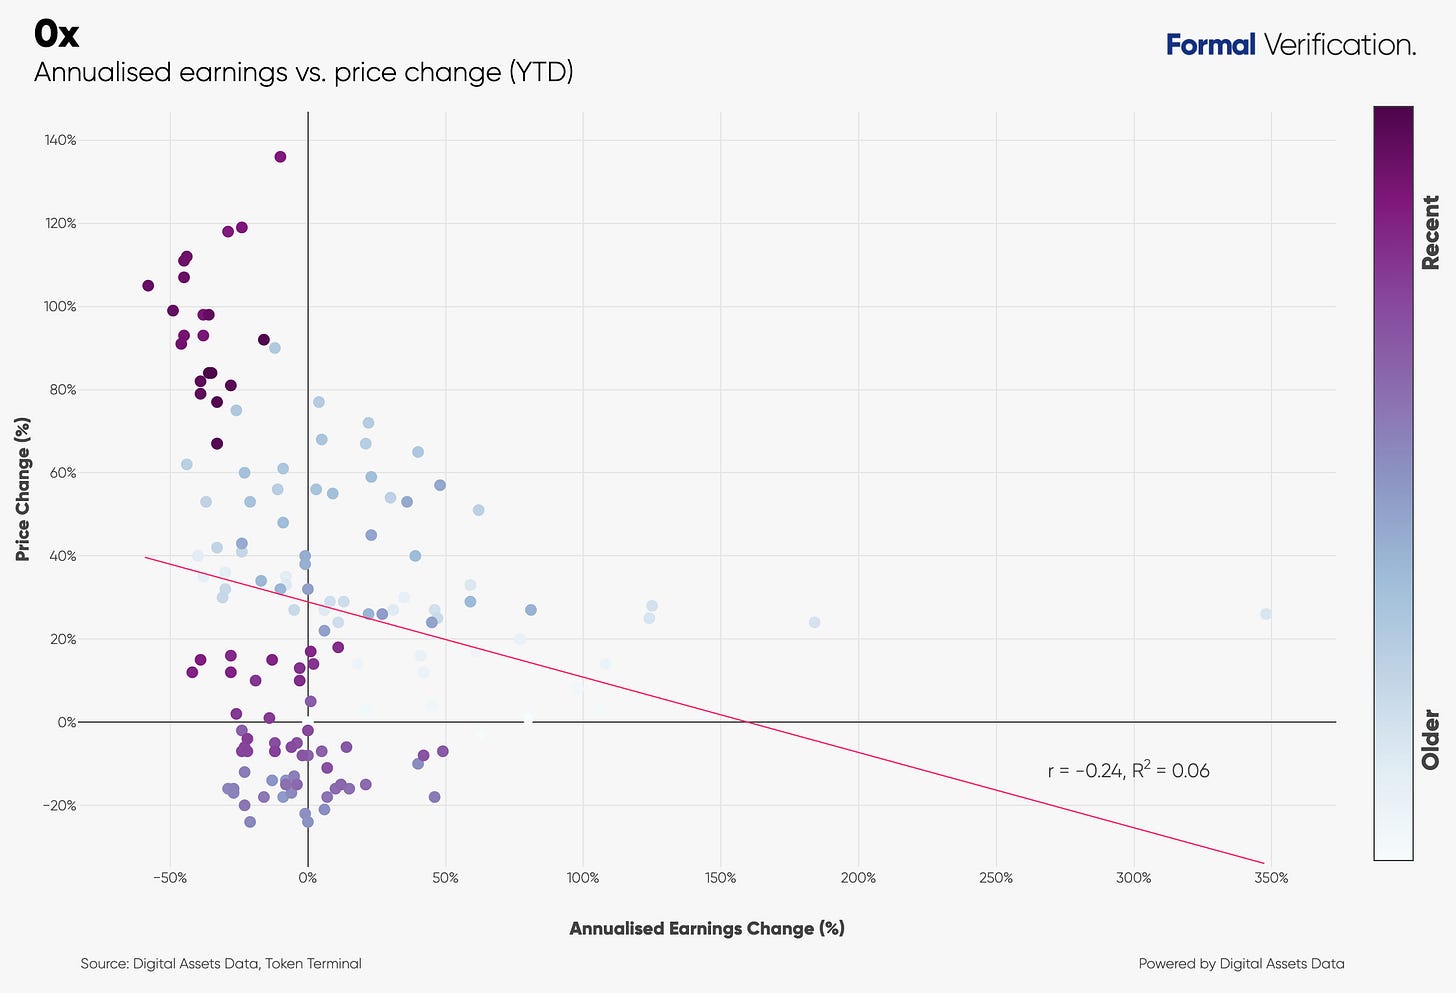
0x released their V3 in November 2019, where ZRX holders are now given the right to receive fees either by market making directly or by delegating ZRX to MMs for a portion of the MMs fees. These MMs decide the percentage. Note that <2% of the ZRX supply is staked to receive trading fee rewards.
What is interesting is that a decrease in annualised earnings has translated to an increase in ZRX price. This is particularly apparent in the last few week. The increase in ZRX seen in early May was largely due to the approval of ZEIP-77 which introduced shorter staking epochs (10 days to 7 days). Ironically, while shorter staking windows was warmly met by the community, the staking rewards were actually decreasing overall relative to the start of January.

MakerDAO
Since MCD last year, MKR holders have been reliant on a large spread between the Dai Savings Rate (DSR) and the stability fee in order get an ‘earning’ from the network. This is because stability fees is now funnelled through to the DSR for Dai holders. The effect of this alone has been a reduction in earnings for MKR holders.
More recently, the 12th March crash led to some severe liquidity issues for Dai which has led to drastically lower stability fees for all collateral asset types (0% for ETH and Bat, 0.75% for USDC, 1% for WBTC). Despite the drastic drops in earnings, there is a large positive linear association found for the period as MKR token price correspondingly fell.

Aave
While being a relatively young protocol, the lending platform currently has $78m total value locked and growing. On the comparison graph above, Aave looked like a prime example of how increased annualised earnings seemed to correspond with an increase in token performance. However digging deeper, if we look at the data since the start of the year, the association between earnings and changes in LEND price have been very weakly negatively associated (note - the coefficient of determination is very low). This is arguably due to Aave being an immature protocol and more time is needed for more effective analysis.

Bancor
For a while, Bancor as an exchange has received little attention but in the last few weeks, it has seen its trading volume pick up - average annualised earnings for May was $1.3m compared to $500k for the month of January.
Bancor is releasing V2 protocol which will be deployed to the Ethereum mainnet in the coming weeks which may explain why we seeing both a climb in BNT price and earnings. We can see that during February, there was a brief disconnect between annualised earnings and price - BNT price increased (Bancor rolled out LP model in January) as annualised earnings fell but BNT then subsequently dropped into negative price territory with the March 12th crash.

Conclusions
As we’ve seen, the relationship between token earnings and price is dynamic and by using time as a third series, we can sometimes give context as to why the relationship between these two variables is evolving in a particular way. This can also help us understand why protocols can differ from one another too.
More broadly, it is also important to consider what we mean by ‘earnings’ when it comes to cryptoassets. P/E ratios have been intuitively selected to value crypto capital assets as these particular assets give the holder a claim to value flows. But simply applying a traditional P/E framework to compare crypto capital assets is unable to capture all of the nuanced characteristics of (live) decentralised networks. Are burn models directly comparable to direct value flows models from a value perspective (e.g. Kyber pre- and post-Katalyst)? Should we consider separate value flows for MMs and delegators in 0x?
Additionally, for some protocols, a true net earning per share is dependent on the total number of tokens actively receiving rewards by being put to work. Consider the Kyber DAO where rewards are divvied up to KNC stakers on a pro-rata basis. Here, income on a ‘worked’ token basis can fluctuate drastically as stakers move in and out while protocol fees effectively stay the same. Therefore, an alternative but dynamic P/E metric could capture relevant network changes such as changes in stake ratio.
As attributes of decentralised networks become ever more complex, we have to continually challenge our notion of value flows for crypto capital assets. In true Kuhnian fashion, new frameworks for new paradigms require time and effort, and we are just getting started.
About Formal Verification
Formal Verification offers both key and concise data analysis and ecosystem research for decentralised networks and digital assets so you can be attuned to the absolute key developments both on and off the chain.
Hurry!
All Formal Verification research will be free for everyone until June 8th. If you subscribe before June 8th, you’ll continue to receive all research at a 20% discount forever as a special thank you for your early support. Free members will only get occasional research posts. Get it locked in.
Formal Verification research is not investment advice and is strictly for informational purposes only. Conduct your own research.


